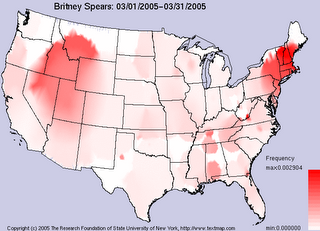

via http://www.algorithm.cs.sunysb.edu/heatmap/person.html
"Examples of our geographic news analysis system. For any given entity in the news, we model the relative amount of exposure this entity has received over a given period of time at every locale in the United States. These maps were generated for the time period 3/2/2005 - 3/25-2005. "
9/11/2006
"Heat Maps" of press coverage
Subscribe to:
Post Comments (Atom)
No comments:
Post a Comment